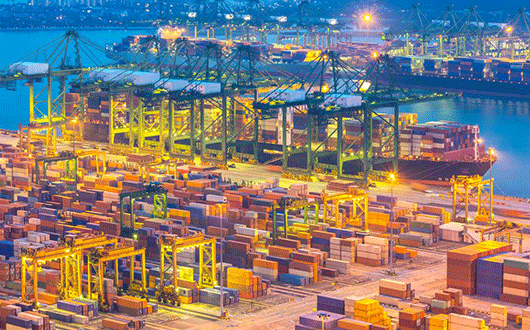
The trade balance worsened by four percent to stand at $13.6 billion in 7MFY16 (Jul-Jan) as per the data released by the Pakistan Bureau of Statistics earlier this week. Imports continue the journey south falling by 6 percent in the seven months of this fiscal year. The problem lies in the steep fall in exports which are down by 14.4 percent or $2.0 billion to stand at $12.1 billion.
Be it the slowdown in China or the shrinking pie of global trade, depressed commodity prices, an overvalued currency, dis-ease of doing business in Pakistan or export competition; policy mix has to be evolved in ways to arrest the continued decline in exports. Pakistan’s export proceeds fell by 5 percent in FY15 to $23.9 billion from its peak of $25.1 billion in FY14.
It’s pertinent to note that the fall in exports is not limited to the slowdown in China and depressed commodity prices which started in 2014, but the exports to GDP ratio was on decline way earlier. Pakistan exports to GDP ratio averaged 13.1 percent in FY95-05 which declined to 10.8 percent in FY06-15. What does this imply? A simple and scary interpretation is that the fast economic growth in FY02-07 was not translated into an expansion of exports as GDP was growing faster than exports and higher demand was being largely filled by imports.
The slowdown became more visible since FY12 as exports to GDP averaged 10.5 percent in FY12-14 and the obvious dent was in FY15 with export to GDP reducing to decade-low 8.8 percent of GDP despite GSP Plus. The ratio may further deteriorate in FY16.
Let’s delve into the reasons for fall in exports during this fiscal year so far. Food group exports are down by 12.4 percent to stand at $2.2 billion in Jul-Jan. Rice exports are down by 13 percent and within it, premium quality basmati is taking the major hit – having fallen by 13 percent to $258 million. This is followed by 23.4 percent reduction in basmati rice exports in FY15 and its share in rice exports has declined from 35 percent in FY14 to 25 percent today, leaving low price rice to dominate exports.
The textile exports are down by 9 percent in 7MFY16 to reach $7.3 billion with major hit in cotton yarn (down by 32% to $790mn in value terms and 30 percent in volume), cotton cloth (10% fall to $1.3bn) and bed wear (plummeted by 7% to $1.2bn).
The problem is worse in case of other manufacturing groups which are down by 19 percent to stand at $1.85 billion in 7MFY16 and the fall is across the board in carpets (22%), sports goods (4.3%), leather tanned (28%), Leather manufacturers (13%) and footwear(21%). Due to higher fall in exports other than textile, the share of textile exports to total exports increased from 57 percent in 7MFY15 to 61 percent in 7MFY16.
Low exports have not really exacerbated the current account balance as imports are falling too, thanks to low oil prices. Barring petroleum group, imports are up by 7 percent in 7MFY16, while petroleum group imports are down by 38 percent. There is a significant pickup in imports of machinery group which is up by 14 percent in Jul-Jan and 36 percent in Jan on YoY.
Machinery group import is now having the highest share in imports – it was recorded at $4.8 billion (19% of imports) versus petroleum group imports at $4.7 billion (18% of total imports). That is an encouraging piece of statistic as higher machinery imports mean that it will fill in the wide infrastructure gap in roads, railways, energy and other sectors. Plus, that may result in expansion in key industries including those related to construction (cement and steel).
However, the fear is that the expansion in industries and infrastructure may not be able to generate an export surplus in years to come. A déjà vu of what happened in last decade – machinery imports as a percentage of GDP averaged 4.1 percent in FY05-10 (2.6% of GDP in FY11-15) but economy slowed down after this expansion and exports to GDP declined thereafter.
Now the economy is back in expansion phase with machinery imports picking up – 2.8 percent in 7MFY16 and it may increase further in next two years. Lets hope, history don’t repeat itself and this time around, the economy may be able to generate export surplus through this expansion.
First published in the BR Research on February 26, 2016.


